 |
|
|
| |
 |
 |
| |
| |
Expertise in tissue array
ALPHELYS is a recognized expert in technology for tissue array that develops innovative solutions since 2002 when Spot Browser® was introduced, a leading digital solutions for analysis of tissue array slides, widely used today. Through a permanent customer relationship, ALPHELYS has developed a strong expertise in tissue arrays requirements, thus resulting in a complete solution for tissue array called Tissue Array Platform.
ALPHELYS introduces today its new generation of tissue arrays analyzer: Spot Browser® 3.
More power, more functions, more automation, more flexibility, this new generation is a concentrate of all the experience accumulated over nearly 8 years with our users.
Spot Browser® 3 brings you the most advanced solution for tissue arrays analysis.
A secure and comprehensive archiving environment
Spot Browser® 3 incorporates an image database IDB® that manages the archiving of all your images, virtual slides, patient data / animal or your experimental data.
This environment secures access, protects your data and simplifies exploitation.
IDB ® can be shared by several teams / labs where images banks are completely secured by restricted user access.
The environment can also handle patient private data with automatic pseudonymization.
ALPHELYS can also advise you on the most suitable storage solution. |
| |
 |
| |
| Brightfield, darkfield, fluorescence: Spot Browser® 3 fulfils all your needs |
| |
 |
| |
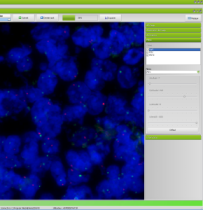
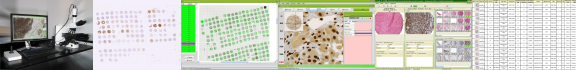
Spot Browser® 3 allows the exploration and analysis of tissue arrays captured in all light conditions: brightfield, darkfield, fluorescence and FISH.
The interface lets you manage and |
|
 |
|
| |
display different fluorescence filters. Image improvement and threshold filters allow you to optimize the quality of your images to bring out the signals.
Slide Scanning Microscope Goodspeed® and its suite of software INAVEO® and Spot Browser® 3 for scanning and analysis of tissue arrays in brightfield and fluorescence, DEPARTMENT OF PATHOLOGY, SCHOOL OF MEDICINE, ARISTOTLE UNIVERSITY OF THESSALONIKI, GREECE. Courtesy of Dr. Mattheos BOBOS. (Picture). |

|
|
| |
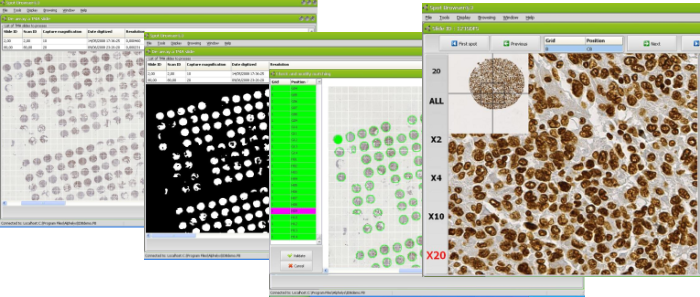
Maximum time saving with the built-in identification of spots
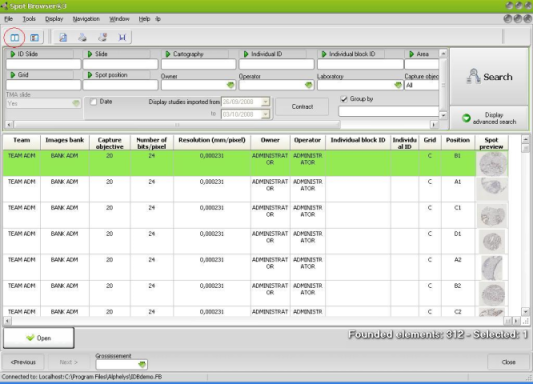
Prior to the analysis of your tissue array spots, identification of spots from the virtual slide is a tedious step, time consuming and prone to errors leading to erroneous association spot / patient.
Spot Browser® 3 offers the most advanced and efficient feature on the market to automatically match tissue array spots of virtual slide with specimen or patient ID. This step only takes a few seconds even for a high density tissue array. The risk of misidentification is eliminated and your analysis secured. This function responds well even in situations of tissue array of very irregular shape, variable size grids, incomplete or even absent spots. |
| |
 |
| |
| A simple, fast and effective solution for your first expertise: annotating spots |
| |
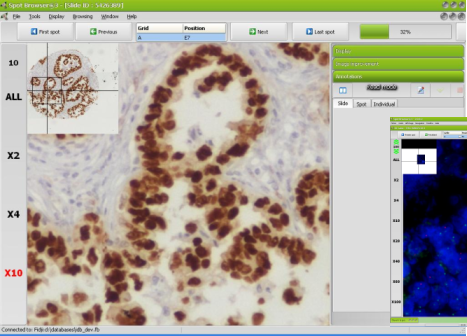
Scoring spots is undoubtedly your main intervention in the analysis of tissue arrays.
Spot Browser® 3 offers spot to spot navigation tools that allow you to quickly score your tissue arrays. You can create the fields of annotations you need in desired data format: numbers, letters, date, free entry text, fix or editable combo...
Fields can be displayed at the interface accordingly to your project. The analysis procedure is very quick, easy and simple with maximum use of the keyboard to move to the next spot and enter annotations. The magnification chosen for the first spot analysis can be automatically retained for the next spots to immediately propose the most suitable view. |
 |
|
| |
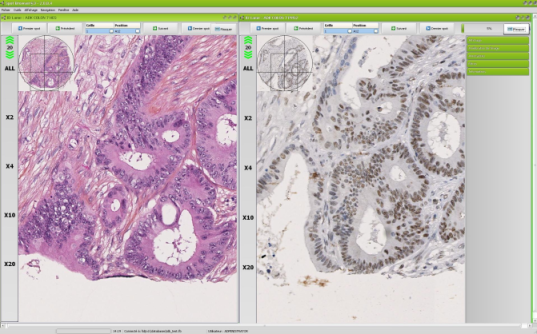
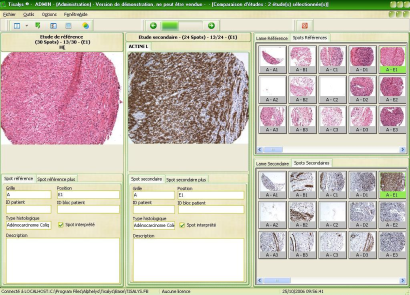
Comparative analyse and reference slide
Spot Browser® 3 allows opening two different TMA slides simultaneously and browsing into those two slides in a synchronized manner. You are thus proposed at the screen same spot position with different stainings or markers so as to compare histologically related structures. This method strongly simplifies orientation into dark field and fluorescence spots as well. |
| |
 |
| |
| Image analysis and quantitative morphometry |
| |
|
| |
| Processing of your tissue arrays data |
| |
 |
All of your data and images are archived into the IDB® data base.
The query interface gives instant access to any slide or spot by querying any ID or set of annotations. No more long lists of virtual slides to browse, just the data you need.
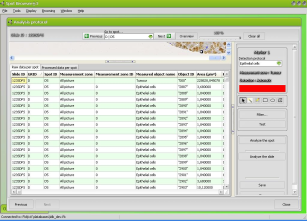
Thanks to TISALYS® module, you can explore all of your data and compare results from various patients, various markers, ….and compile them to export for further biostatistics. |
|
| |
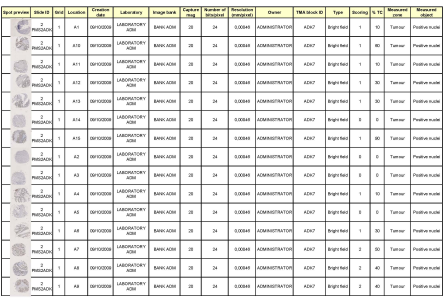
| Compatibility |
| |
| Spot Browser® is an open environment. You can export your images in the format and quality you need. You can also export your annotations and results into an Excel spreadsheet together with spot image thumbnails as illustrated here on right, for further processing into various other environments like biostatistics. |
 |
|
| |
| Connectivity to slide scanners |
| |
Spot Browser® 3 is designed to process images and virtual slides originating from various environments.
It can be of course virtual slides from ALPHELYS GoodSpeed® Slide Scanning Microscope but also from slide scanners from other vendors. Typically, Spot Browser® 3 is interfaced with the Hamamatsu Nanozoomer® slide scanners and interfaces to other scanners are currently under development. You can benefit from high end Spot Browser® 3 functionalities in connection with your preferred and most suitable slide scanner for your lab without compromise!
If your budget is limited, Spot Browser® 3 can also analyze tissue array spot images captured “manually”. We can propose a simplified solution based on our image capture software OneSHOT® connected to high quality camera onto a basic microscope but still with features to authorize rapid capture of spots without loosing tracking of identification. Images are directly and automatically saved into IDB® data base which enables then access to Spot Browser®3 analysis. This solution requires TISALYS® module for patient data importation. This basic capture station can then be easily upgraded in a later stage to a more sophisticated and high throughput solution GoodSpeed® Slide Scanning Microscope.
Do not hesitate to contact us, we certainly have the solution that will be the best compromise to fit both your needs and budget constraints!
Tissue array slides scanning and analysis platform based on Nanozoomer® slide scanner and INAVEO®/ Spot Browser® 3 software suite, Hôpital Universitaire COCHIN, Laboratoire d’Anatomie Pathologique, Paris, France. Avec l’aimable autorisation du Dr Benoît TERRIS. |
| |
| Scalability |
| |
| ALPHELYS develop continuously new features to improve its software solutions to always better fit to your needs and answer your comments. Your image platform is periodically updated to maintain the performances and functional levels you require to achieve your projects. |
 |
 |
|
| |
| Specifications |
| |
ALPHELYS software are designed for Windows 2000, NT, XP et 7.
IDB® data base exploits relational data base freeware environment FIREBIRD.
|
| |
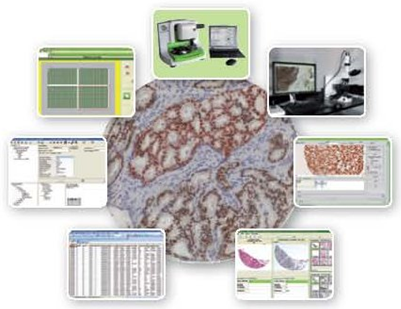
| The Tissue Array PlatForm |
| |
| The Tissue Array PlatForm is a unique solution dedicated to tissue array. It brings a complete solution to rapidly and efficiently achieve fundamental and clinical research programs based on tissue arrays exploration. This includes tissue array map design, construction, scanning, analysis and processing. The Tissue Array PlatForm guarantees a complete tracking and best yield in data management and processing. This significantly reduces budget, time and human resources needs. |
 |
| |
| ALPHELYS profile |
| |
ALPHELYS is a French company founded in 2001, which strategy is to develop innovative, instrument, software and reagent solutions to optimize and explore tumour banks. Tumour banks are key resources in the development of new diagnostic, prognostic and therapeutic strategies for Cancer.
ALPHELYS proposes a formalin-free non toxic tissue fixative that replaces formalin and makes all biopsies and surgical specimens compatible with molecular research and diagnostic.
ALPHELYS has been recently awarded European Innovative Company 2009 by the European network of the Junior Chambers of Commerce.
To order your Tissue Array Analysis Solution:
|
Virtual Slide Image Data Base IDB® with INAVEO® viewer
Tissue Arrays Analysis Software Spot Browser® 3
Tissue Arrays Data Processing Module TISALYS®
|
cat. nbr. 01-INV-VS
cat. nbr. 01-SBR3-ML
cat. nbr. 01-TIS-01 |
|
| |
 |
|
|
ALPHELYS,
Ferme des Ebisoires, Impasse Paul Langevin, 78370 Plaisir - France
Tel +33 (0)1 30 07 52 95 - Fax +33 (0)1 30 07 51 56 - eMail
info@alphelys.com
Copyright © 2001/2011 ALPHELYS, all rights reserved.
|
|
|
|
|